Mit dem Makro Kompass habt ihr die weltweiten Märkte mit einem Indikator im Blick.
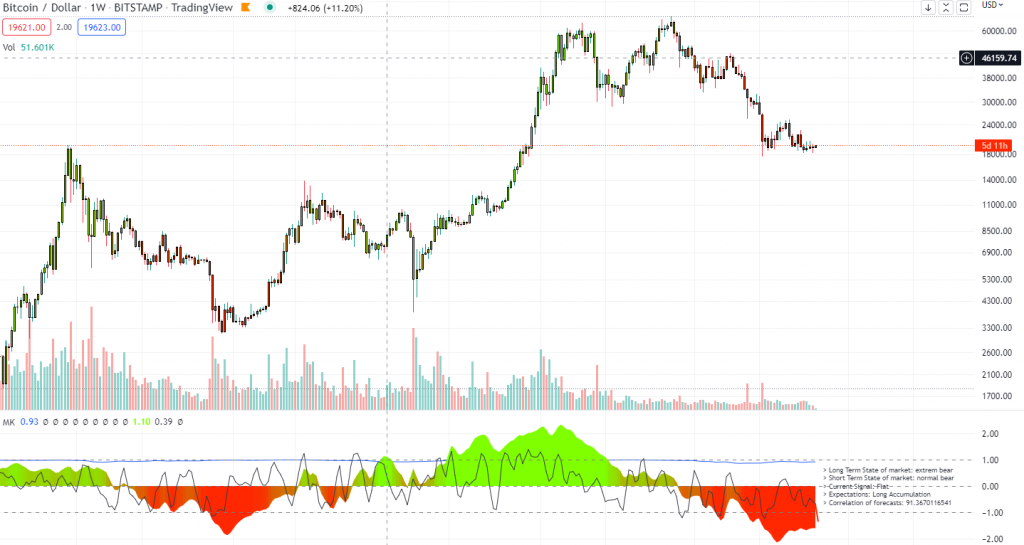
Der erste unserer Tradingview Indikatoren, den wir euch vorstellen wollen ist unser Makro Kompass.
Was nutzt mir der Indikator?
Der Name des Makro Kompass gibt schon sehr viele Info über seine Funktionsweise. Er soll als technischer Kompass dienen, um mit einem Blick bewerten zu können, wie sich die Anleihen-, Währungs-, Aktien- & auch Kryptomärkte bewegen. Zudem gibt der Indikator auch noch eine Vorhersage, basierend auf der linearen Regression, ab.
Wie lese ich den Makro Kompass?
Einmal bei Tradingview hinzugefügt , kann man den Indikator unabhängig des unterliegenden Marktes betrachten. Wir empfehlen den Indikator in der Wochen- oder Tageszeiteinheit zu verwenden. Die unterliegende Fläche signalisiert die stärke der Risikoanlagewerte wie Aktien & Bitcoin. Umso grüner, desto stärker sind die Risikoanlagewerte momentan und desto höher sollte die Allokation im Portfolio sein. Die schwarze Linie stellt den kurzfristigen Trend dar. Der Indikator gibt 4 verschiedene Signale. Am oberen Ende des Makro Kompass werden die Verkaufssignale gegeben. Zum einen die Short Distribution Signale. Diese geben Signale zur Profitmitnahme im aktuellen Aufwärtstrend und kommen Zustande wenn der kurzfristige Trendindikator im Aufwärtstrend überhitzt. Die Trend Short Signale ergeben sich bei einem Bärenmarkt der Risikoanlagewerte und einer kurzfristigen Aufwärtsrally. Bei den Kaufsignalen findet die umgekehrte Logik Anwendung.
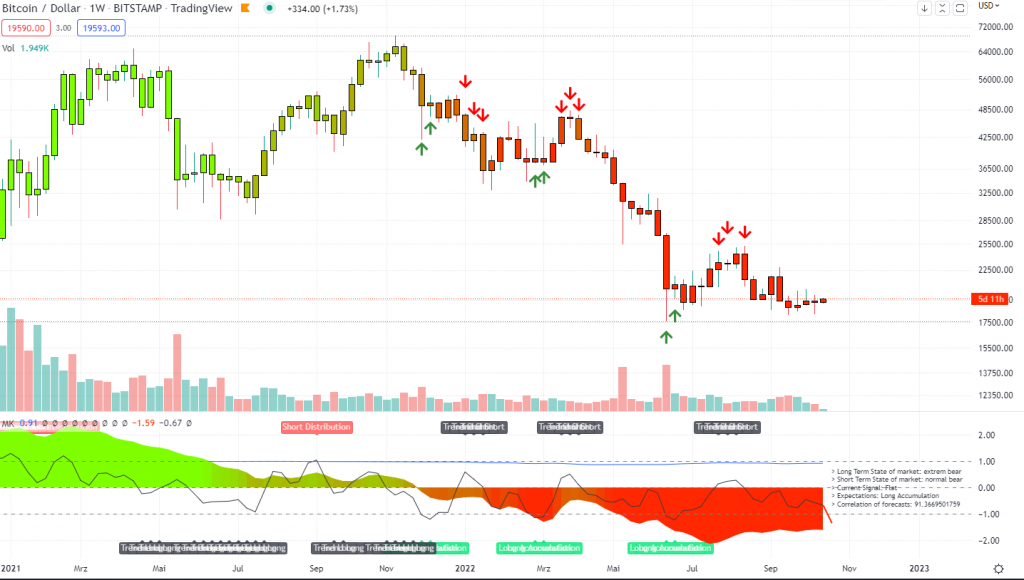
Was sagt mir die Vorhersage?
Die Vorhersage des kurzfristigen Trends basiert auf dem Trend des letzten Jahres. Was heißt, wenn wir uns wie aktuell, seit knapp einem Jahr in einem Abwärtstrend befinden sind die Vorhersagen des Makro Kompass tendenziell abwärtsgerichtet. Dreht sich der langfristige Makrotrend, werden auch die kurzfristigen Vorhersagen wieder tendenziell positiv ausfallen.
Wie investiere ich mit dem Makro Kompass?
Du kannst dir einfach das Skript bei Tradingview hinzufügen und loslegen. Allerdings empfehlen wir dir für ein besseres Verständnis zuerst noch unser Video zum Makro Kompass anzuschauen um das maximale rauszuholen!
Makro Kompass Skript
// This source code is subject to the terms of the Mozilla Public License 2.0 at https://mozilla.org/MPL/2.0/
// © xxxdinis

//@version=5
indicator('Macro Kompass', 'MK')

//TWAP
len_sma = input(52)
len_sma_s = input(4)
smoothing = input(2)
th1 = input(1)
th2 = input(-1)
showBcol = input(true, title='Show barcolors')
showComp = input(false, title='Show Components')
showInfo = input(true)
showForecastBacktest = input(false)
c1 = input(#7fff00)
c2 = input(#ff2800)
p = input(52, 'Lookback Window')
fp = 1


simple_mean(x, p) => x[1] + ta.sma(ta.change(x, p), p)

teny = request.security('US10Y', timeframe.period, ohlc4)
twoy = request.security('US02Y', timeframe.period, ohlc4)
threem = request.security('US03MY', timeframe.period, ohlc4)
twoyear_yc = teny - twoy
threemonth_yc = teny - threem
ndx = request.security('NDX', timeframe.period, ohlc4)
btc = request.security('BTCUSD', timeframe.period, ohlc4)
dxy = request.security('DXY', timeframe.period, ohlc4)

//sma
twoyear_strength = (twoyear_yc-ta.sma(twoyear_yc,len_sma))/ta.stdev(twoyear_yc,len_sma)
threemonth_strength = (threemonth_yc-ta.sma(threemonth_yc,len_sma))/ta.stdev(threemonth_yc,len_sma)
ndx_strength = (ndx-ta.sma(ndx,len_sma))/ta.stdev(ndx,len_sma)
btc_strength = (btc-ta.sma(btc,len_sma))/ta.stdev(btc,len_sma)
dxy_strength = (dxy-ta.sma(dxy,len_sma))/ta.stdev(dxy,len_sma)
strength = ta.sma(((twoyear_strength+threemonth_strength+ndx_strength+btc_strength-dxy_strength)/5),smoothing)

//sma short term
twoyear_strength_e = (twoyear_yc-ta.sma(twoyear_yc,len_sma_s))/ta.stdev(twoyear_yc,len_sma_s)
threemonth_strength_e = (threemonth_yc-ta.sma(threemonth_yc,len_sma_s))/ta.stdev(threemonth_yc,len_sma_s)
ndx_strength_e = (ndx-ta.sma(ndx,len_sma_s))/ta.stdev(ndx,len_sma_s)
btc_strength_e = (btc-ta.sma(btc,len_sma_s))/ta.stdev(btc,len_sma_s)
dxy_strength_e = (dxy-ta.sma(dxy,len_sma_s))/ta.stdev(dxy,len_sma_s)
strength_e = ta.sma(((twoyear_strength_e+threemonth_strength_e+ndx_strength_e+btc_strength_e-dxy_strength_e)/5),smoothing)

//lin reg
forecast = simple_mean(strength_e, p)
var line strength_fc = na
line.delete(strength_fc[1])
coloring_fc = color.from_gradient(forecast, th2, th1, c2, c1)
strength_fc := line.new(time, strength_e, time + 60 * 60 * 24 * fp, forecast, xloc.bar_time, extend=extend.none, style=line.style_solid, color=coloring_fc, width=2)
cor_fc = str.tostring(ta.correlation(strength_e[1], forecast, p)*100)

//signals
showcross = input(true, title='Show Buy/Sell')
trend_long = strength > 0 and strength_e < 0
trend_short = strength < 0 and strength_e > 0
depri_long = strength < 0 and strength_e < th2
eupho_short = strength > 0 and strength_e > th1
current_signal = trend_long ? 'Trend Long' : trend_short ? 'Trend Short' : depri_long ? 'Long Accumulation' : eupho_short ? ' Short Distribution' : 'Flat'
coloring = color.from_gradient(strength, th2, th1, c2, c1)

trend_long_fc = strength > 0 and forecast < 0
trend_short_fc = strength < 0 and forecast > 0
depri_long_fc = strength < 0 and forecast < th2
eupho_short_fc = strength > 0 and forecast > th1
forecast_signal = trend_long_fc ? 'Trend Long' : trend_short_fc ? 'Trend Short' : depri_long_fc ? 'Long Accumulation' : eupho_short_fc ? ' Short Distribution' : 'Flat'

plotshape(showcross and depri_long ? -2 : na, location=location.absolute, style=shape.labelup, color=color.lime, size=size.tiny, text='Long Accumulation', textcolor=#ffffff, transp=20)
plotshape(showcross and eupho_short ? 2 : na, location=location.absolute, style=shape.labeldown, color=color.red, size=size.tiny, text='Short Distribution', textcolor=#ffffff, transp=20)
plotshape(showcross and trend_long ? -2 : na, location=location.absolute, style=shape.labelup, color=color.black, size=size.tiny, text='Trend Long', textcolor=#ffffff, transp=20)
plotshape(showcross and trend_short ? 2 : na, location=location.absolute, style=shape.labeldown, color=color.black, size=size.tiny, text='Trend Short', textcolor=#ffffff, transp=20)


barcolor(showBcol?coloring:na)

//plots
plot(showComp ? twoyear_strength : na)
plot(showComp ? threemonth_strength : na, color=color.black)
plot(showComp ? ndx_strength : na, color=color.purple)
plot(showComp ? btc_strength : na,color=color.orange)
plot(showComp ? dxy_strength : na,color=color.green)
plot(showComp ? na : strength,color = coloring,transp = 60, style = plot.style_area)
plot(strength_e, color = color.black)
plot(showForecastBacktest ? forecast : na)
hline(0)
hline(th1)
hline(th2)

//info label
info = '> Long Term State of market: ' + (strength > th1 ? 'extrem bull' : strength > th1/2 and strength < th1 ? 'normal bull' : strength > 0 and strength < th1/2 ? 'critical bull' : strength < th2 ? 'extrem bear' : strength < th2/2 and strength > th2 ? 'normal bear' : strength < 0 and strength > th2/2 ? 'critical bear':na) + '\n> Short Term State of market: ' + (strength_e > th1 ? 'extrem bull' : strength_e > th1/2 and strength_e < th1 ? 'normal bull' : strength_e > 0 and strength_e < th1/2 ? 'critical bull' : strength_e < th2 ? 'extrem bear' : strength_e < th2/2 and strength_e > th2 ? 'normal bear' : strength_e < 0 and strength_e > th2/2 ? 'critical bear':na) + '\n> Current Signal: ' + current_signal + '\n> Expectations: ' + forecast_signal + '\n> Correlation of forecasts: ' + cor_fc
lbl = showInfo and barstate.islast ? label.new(bar_index, 0, info, xloc.bar_index, yloc.price,color.new(color.blue, 100), label.style_label_left, color.black, size.small, text.align_left) : na
label.delete(lbl[1])